Chapter Introduction: Model Deployment
We've built a model. We've calibrated it. We've assessed it. We've made it tell us its secrets. We don't want the model to simply sit on our laptop. We also don't want to manually run it each time we want a new set of predictions. We need to put the model into production so that its full power can be experienced. When we build a data science model, our goal should be to put it into production. Broadly, this means persisting the model in an API or having it automatically run on a schedule.
Initially setting up a production machine learning system is a moderate amount of work. A proper architecture cannot be whipped up lickity split. A number of components exist for a proper and fault-tolerant system. That said, setting up such a system is not rocket science. We'll walk through the steps in this chapter.
Important Chapter Note
This is a very advanced chapter, the most difficult in the book in terms of technical depth. It's also a very long chapter that introduces a ton of concepts. You may have to read through sections multiple times. Likewise, many of these topics have entire books authored about them. I only devote a section to most of them. My hope is this chapter will introduce you to a number of important concepts and supply working code examples for when you're ready.
Chapter Video
Watch this video to better understand the nature and scope of the chapter. (Based on your app infrastructure, the background scheduler to refresh the config may or may not work. Either way, you can set up tools and processes to ensure the refresh endpoint is hit whenever config values are updated. Likewise, you could build in timed checks in a lower-level way.).
Resources cited in video.
Building a Flask API
We shall first cover how to persist our model in a REST API. A REST service is like a contract: send me data in a specific format, and I'll return to you data in a specific format. Our API will take a POST request containing a JSON object with client data. It will then respond with the probability the customer will churn. We will use the Flask framework to develop this app, which is a bare-bones web framework that allows high customizability.
We first need to add a function to data/db.py to retrieve our app configuration values from MySQL. Don't worry: we'll cover app configurations in an upcoming section.
We also need to add an app_settings.py file in root, allowing us to easily set variables that we won't want to change. This helps make our design loosely-coupled.
Likewise, we need to create an app_helpers file in the helpers directory.
Lastly, we have our API code, stored in app.py in our root directory. At a high level, this file does the following
(some of the additional features you see in the code will be covered in later sections):
- Responds to configuration settings in a MySQL table. Again, more on configs soon.
- Integrates with Sentry for error alerting.
- Uses a machine learning model to return the probability of the given customer churning.
- Logs input and output data to S3 and MySQL.
Pay most attention to the predict endpoint.
A note on databases. For our application, we also need to launch a staging database. In chapter 7, we set up a MySQL RDS instance on AWS. We should set up a second database in the same fashion to serve as our staging database. (Refer to Setting up MySQL on AWS in Chapter 7 for a refresher). In general, we should have staging and production versions of our application. We shall create those later. A staging application is for testing and verification...we don't want to test in production! Likewise, the staging application should work from staging database tables, not production ones. This is because, well, staging is for testing, and some tests might involve database tables. Again, we don't want to test and experiment in production.
In our API, we might also face something called a cold-start problem. That is, our first response is slow before we build caches (i.e. running a function once and storing the results for a period of time). We could potentially run expensive functions while our application boots.
Adding a Request Token to Our API
Right now, our app is sitting on our local laptops, so we don't have too many security concerns. Yet. However, we should start thinking about how we want to secure our application. On AWS, we will only allow certain IP addresses to reach our application, which is quite important for our security posture. That said, we can take other steps to protect our application. One potential step is adding a token. Our app will only respond to requests that include the specified token.
The simplest implementation would be something like the following at the top of our predict function.
    session['endpoint'] = 'predict'

    input_data = request.json

    if not input_data.get('token') == ACCESS_TOKEN:

       return Response('access denied', status=403)
We also need to "import Response from flask" and "import ACCESS_TOKEN from app_settings". Of course, we need to declare ACCESS_TOKEN in app_settings.py. This should be pulled from AWS Secrets Manager.
A better, though more time-consuming, solution is to use a JSON Web Token. We won't cover that in this book, but you can find a good tutorial here.
Configuration as Code
We have referenced our application configuration multiple times thus far. In reality, our application is a
combination of code and configuration. Our app configuration can be incredibly important, and we should treat it
as such. We will use the Configuration as Code paradigm. Configuration as code can take on many forms. However, for
our use case, we will take it to mean the following.
- We will be able to track our config changes over time, which means we need be able to version such changes. Likewise, we should be able to easily revert config changes if they cause errors.
- We can update our configuration without needing to re-deploy our application. We want to have independent config updates, bespoke testing and deployment, and the ability to easily audit config changes.
If we store our configurations in a flat file in our repository, we get the first requirement but not the second. A common alternative is to store the configurations in a database table, which is the route we will take. This is only logical. If we want independent config changes, we need our config to live outside our code repo. We, therefore, need a location from which our application can read. A database table is a natural choice. We shall execute the following in MySQL Workbench to create staging and prod config tables after connecting to each database respectively.
        create table if not exists churn_model.config (

        id int not null auto_increment primary key,

        meta__inserted_at timestamp not null default current_timestamp,

        config_key text,

        config_value text

        );


        insert into churn_model.config (config_key, config_value)

        values ('proba_cutoff', 0.65);
We can update our config table whenever we want to make a change. Nice. However, how will our application know a config change has been made? Logically, there are two main ways: 1) the app can periodically check for changes and apply them, or 2) we can tell the app a config change has occurred. Our application provides both capabilities. In initialize_app(), we set a background scheduler to run every 3,600 seconds to refresh the config based on the most recent entries into our config table. We communicate to our app through GET and POST requests, so we can also hit the config-refresh endpoint, which will prompt the app to grab the latest entries in the config table and apply them.
Updating our database table is all well and good. However, we might face some limitations with this approach. For one, it might be a bit cumbersome over time. Second, we could unintentionally inject errors. Messing up an insert statement is plausible. Third, if we want a non-technical person to be able to update the config, we should obviously not expect them to insert values into a table. What's the solution then? One option is to build a simple user interface that can be employed to update the config. This solution will satiate our concerns: updating a UI will be less cumbersome and error prone (if designed correctly, of course), and a non-technical user can easily interact with it. The idea of a configuration UI is discussed in the famous Google Site Reliability Engineering Handbook.
We will create our config application in a new repository. We want to update and manage its code separately. The structure we will use for the config app can be found here.
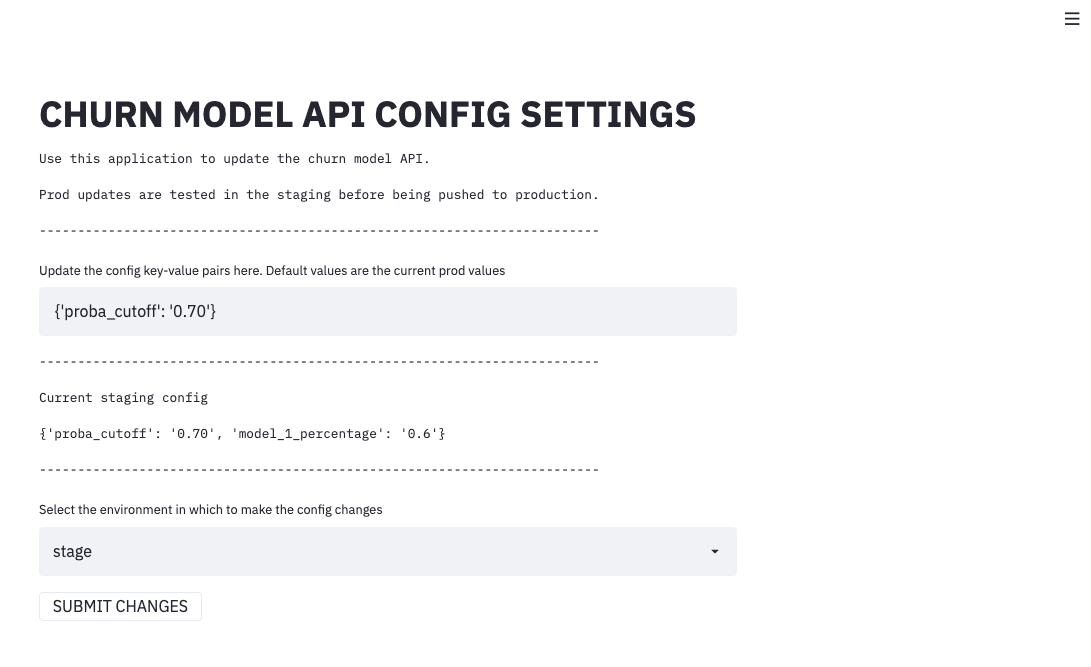
We leverage the Streamlit framework to develop our UI, which allows us to code Python and get HTML, CSS, and JavaScript. The app will simply allow us to submit changes to our config MySQL table. Updates will first be screened to see if they have appropriate values. Next, they will be tested in our staging environment. Finally, we will be asked if we want to push the updates to prod.
Testing our API with PostMan
Our code will currently allow us to test our app using a local web server. We enable this local server by having the following boilerplate at the bottom of our script. Setting debug to True will pick up code changes we make, meaning we won't have to keep killing and restarting the server.
app.run(debug=True)
This is not a suitable production web server, and we want to remove it before we deploy our application onto AWS. However, it's useful as we can easily test our code locally by simply running app.py. This will serve our application on localhost port 5000 (http://127.0.0.1:5000). To verify the application is running locally, we can run the following command from terminal to hit out healthcheck endpoint.
$ curl http://127.0.0.1:5000/health
We can also hit our predict endpoint with a sample payload using Postman, which we installed in a previous chapter.
Caching using cachetools and Leveraging a Feature Store
In our application, there might be data we want to cache. That is, we want to fetch it once and then keep it in memory for faster access. A common type of cache is a TTL (time to live). Basically, we define for how long the cache is valid. For example, a 60 second TTL means the cached data will be valid for 60 seconds. After that period of time, the cache is expired and the data will be re-fetched before being valid again for 60 seconds.
In our application, let's say we also wanted to return the estimated lifetime value of the customer. This is the type of information that might be in a feature store. A feature store is essentially a lookup table of ready-to-go features. For example, there might be an ETL process that runs, say, every few days to update a customer's lifetime value. We can simply query this feature and use it; we don't have to calculate anything.
        client_id = input_data.get('client_id', '000000')

        ltv_df = get_client_ltv_table()

        client_ltv = (ltv_df.loc[ltv_df['client_id'] == client_id])['ltv'].iloc[-1]
The client_ltv variable can then simply be added to our response.
Caching using Redis
Redis is a popular and effective in-memory database. It's super fast for looking-up data. Therefore, it also serves as an excellent cache. As an example, we might want to keep a cache of all the clients that our model has seen recently. Keep in mind this is simply an example, but the methodology can be easily expanded to other use cases.
We will first use a local Redis Server. In an upcoming section, we will show how to set up a remote Redis server on AWS. To install Redis locally, we can use Homebrew.
$ brew install redis
We also need to install the Python redis package.
$ pip3 install redis
We can fire up the redis server by issuing the following command.
$ redis-server
In data.db, we need to initialize the Redis client as a global variable.
r = redis.StrictRedis()
In the same file, we can also add the following functions to help us interact with Redis.
    def record_client_id(client_id):

       """

       Pushes a new client_id to the client_ids Redis list.


       :param client_id: client id

       """

       r.lpush('client_ids', client_id)


       def get_client_ids_already_seen():

       """

       Gets all of the values in the client_ids Redis list.


       :returns: list

       """

       return r.lrange('client_ids', 0, -1)
In helpers/app_helpers, we shall add the following two functions.
    def decode_list_str_elements(lst, decode_type='utf-8'):

       """

       Converts all elements to utf-8.


       :param lst: list

       :param decode_type: way to decode the string elements; default is utf-8

       :returns: list

       """

       lst = [i.decode(decode_type) for i in lst if type(i) == str]

       return lst


    def count_list_item_occurrences(lst, lst_item):

       """

       Counts the occurrences of lst_item in lst.


       :param lst: list

       :param lst_item: valid object that can appear in a list

       :returns: int

       """

       return lst.count(lst_item)
In app.py, after importing these functions, we can implement them in our prediction function.
        client_id_list = get_client_ids_already_seen()

        client_id_list = decode_list_str_elements(client_id_list)

        client_id_count = count_list_item_occurrences(client_id_list, client_id)
We can then record the client_id to Redis and add client_id_count to our output dictionary.
        output['recent_times_id_seen'] = client_id_count

        record_client_id(client_id)
Using Redis as a Task Queue
Redis can also be used as as task queue. If we have a long-running process, we might want to return a response in our API while that process still runs. We can use a task queue for such a situation. Here's a common example: you book a hotel room online. The backend API will render a response that your booking has been processed. The API will then offload a task onto a task queue to send you a confirmation email. The web server isn't sending the email; it is telling another resource it needs to send you an email.
We first need to create data/redis_worker.py
We can then add the following code to helpers/app_helpers.py
As a global variable in app.py after we run initialize_app(), we need to add the following:
q = Queue(connection=conn)
We also need to add the following import statements:
    from rq import Queue

    from data.redis_worker import conn
Before we return our output in the predict function, we also need the following call:
    job = q.enqueue_call(

                func=send_prediction_email, args=(output, ),
        result_ttl=5000

      )
To make this work, we first need to start our redis server again, and we also need to run our Redis worker.
$ redis-server$ python3 data/redis_worker.py
If we run our app on our local server and hit the predict endpoint with a post, our application will respond and our Redis worker will send us an email. If the email process gets hung up, it's not a huge deal as it does not interfere with our app responding.
Setting up a Remote Redis Server
In the previous two sections, we used a local Redis server. However, in a production setting, we might to use a remote server. Let's set one up on AWS.
AWS has an excellent tutorial that you can follow to launch a remote Redis server using Elasticache. I recommend following it. An important note about Elasticache: it natively only connects to resources in the same Virtual Private Cloud on AWS. Without quite a bit of jimmy-rigging, we can only test the connection in AWS on the same VPC. Likewise, for the security group for the Elasticache server, I recommend two rules:
- Allow SSH on port 22 for your IP address
- Allow traffic from port 6379 from the security group itself
While the Elasticache server is launching, which takes ~10 minutes, launch an Amazon Linux 2 AMI EC2 instance. Place it in the same VPC and security group as the Elasticache server.
Once the EC2 instance has launched, ssh into it.
$ ssh -i /path/to/key-pair ec2-user@put-public-dns
Once connected to your instance, you can issue the following commands to install the redis-cli.
        $ sudo yum install gcc

        $ wget http://download.redis.io/redis-stable.tar.gz && tar xvzf redis-stable.tar.gz && cd redis-stable && make
Once the Elasticache server is available, grab the Primary Endpoint.
In your EC2 instance, run the following command.
$ ./src/redis-cli -c -h endpoint
That will take you to a command prompt where you can enter "ping" to test the connection. If you get "pong", it's a success!
Since ECS (how we will run our application) simply runs EC2 instances, this mimics how you would set up Redis for your production application.
A/B Testing Models
We may want to A/B test multiple models in production. In fact, this is generally something we should almost always do. With this in mind, our application code might look something like the following. As you will notice, we only are testing two models, but you can see how it would be easy to extend the code to more models.
Shadow Deployment of Models
Sometimes, we might want to test a model in production. That is, we allow it to make predictions in production but not decisions. This is a truly great way to validate a model and confirm it will work in production as intended. How can we accomplish such an aim? We have two options. The first, and easiest, is just to adjust the API so that the input payload gets run all models, the logging includes the predictions from all models, and the response returns only the prediction from the primary model. This is likely a pretty good solution since it's easy to implement, as long as we can stand our response being several milliseconds longer. The other, and slightly more difficult, is to offload the second prediction onto a task queue. We'll take the easy route and just run two models sequentially. Basically, we can just use our A/B testing code from above and simply toggle the model_1_percentage to 1.00.
Creating a Holdout Set
How do we know our model is driving value? We can talk about ROC AUC and calibration plots all we want. However, the best way is to compare our model against some status quo baseline. Recall the heuristic model we developed in chapter 10? We might opt to deploy that into production and assign a small number of requests to receive the "heuristic" treatment. We can then track the efficacy of the machine learning model vs. the heuristic model. In the A/B Testing Models section, we apply the heuristic model. An alternative is that we could assign a certain percentage of customers to never receive a prediction as part of a holdout group. The route we select is based on our circumstances. We will discuss this topic more in chapter 15.
Creating a Simple Model UI in Flask
Depending on our use case, we may want to put a user interface over our model. This is fortunately pretty easy in Flask. We simply need to render our response in HTML.
Securing our Model UI with a Password
For our model UI, we might desire to add some additional security. We shall see what it would take to add a password to the UI. In fact, in our code in the previous section, our model_interface endpoint checks to see if we are logged in. If not, it will direct you to the login endpoint.
You also notice we are checking if a username and password match what we have on record in MySQL. You can easily recreate the table based on the query.
You might also notice the following in our login endpoint.
We are taking the password the user submitted and hashing it. Why? Because we store hashed password, not plain-text passwords. This is an important security measure. We can't reverse a hash. Therefore, if out database is breached, the bad actor won't be able to figure out users' actual passwords (there are databases of hashes that correspond to common passwords, which underscores the importance of setting unique passwords). However, we can still use the hashed passwords - we can check if the hash of the entered password matches what we have on file. If they do, the user entered the correct password.
Unit Tests
We want to have tests that we can run against our code. If we make a change, we don't want to unintentionally break something. We can author unit tests in our tests folder that can be run to check for any regressions. These tests will be part of our CI/CD pipeline on AWS. If any tests fail, that will stop our production build and prevent bad code from being pushed into production.
Security Tests
We can also run automated security tests via the Bandit framework. These can also be a part of our CI/CD pipeline on AWS.
        $ pip3 install bandit

        $ bandit -r /project-repo-path/
This will spit out a report of common security issues found. This is only the tip of the iceberg. You can learn more about Bandit and how to customize the security scanning here.
Dockerizing our Application
Docker was discussed quite a bit in chapter 4. We require a Dockerfile to create our image and container. Compared to those in chapter 4, the big "new" item in this Dockerfile is setting up the container to run as a non-root user. This is a security protocol. If our container were to get hijacked, the bad actor would be able to do less damage with a less powerful user.
We can also use Docker scan to review our Dockerfile for security vulnerabilities. You can learn about this capability here.
Using Docker Compose
For our Redis task queue, we need to run two Python scripts and spin up the Redis server. This isn't a problem locally. If we want to run multiple processes in a Docker container, one avenue is to use Docker Compose. This allows us to run multiple container processes in conjunction. We still need our Dockerfile, but we need to remove the final line: 'CMD ["./run.sh"]'. Additionally, we now need a docker-compose.yml file.
We can then run the following locally to run our Docker container with Compose.
$ docker-compose up
We won't use Docker Compose to deploy our application, but it's beneficial to know how it works. It's the gateway to understanding Kubernetes, the topic of our next section. There are two main reasons we won't use Docker Compose. First, using Docker Compose on AWS is actually pretty cumbersome; the overall support is lacking in my opinion. Second, Kubernetes is a better alternative, though more complicated.
Using Kubernetes
Docker Compose is a useful tool. However, every service runs on a single machine. Therefore, we cannot scale individual components of our application, though this is something we might want to do. To accomplish this aim, we could use Kubernetes, a container orchestration tool. Kubernetes allows us to scale and manage individual components of our application, which can be a major benefit. The code in this repo comprises a Kubernetes app. You can research the individual components.
Important note: This section is highly based on this excellent tutorial. I use a lot of the same naming conventions. Full credit goes to the author of this work for laying out the kubectl commands and much of the yaml files.
You'll first need to install minikube, which is "local Kubernetes".
        $ curl -LO https://storage.googleapis.com/minikube/releases/latest/minikube-darwin-amd64
        $ sudo install minikube-darwin-amd64 /usr/local/bin/minikube
We can run the app locally using the following commands.
        $ minikube start

        $ eval $(minikube docker-env)

        $ kubectl create -f redis-master-deployment.yaml

        $ kubectl create -f redis-master-service.yaml

        $ docker build -t app .

        $ kubectl create -f web-flask-deployment.yaml

        $ kubectl create -f web-flask-service.yaml

        $ kubectl create -f rq-worker-deployment.yaml
We can verify our services are running with the following command.
$ kubectl get pods
We can then go to our app.
$ minikube service web-flask
You'll have to change "http" to "https" since we are using Talisman for https redirects. If you hit the run endpoint, this will fire off an email using our Redis task queue.
Lastly, you can use AWS's Elastic Kubernetes Service (EKS) to deploy your Kubernetes application.
Infrastructure as Code with Pulumi
In previous chapters, we have used Pulumi to create AWS resources. These have mostly been one-off tasks. We will now use Pulumi in a more systemic way to deploy our models onto AWS. Prior to doing so, let's review why we don't want to always use the AWS console and would rather use a tool like Pulumi.
First, especially for involved tasks, using the console can be cumbersome. Second, using the console is not a repeatable process per se, and it could be easy to click the wrong item and inject a bug or security flaw. Ideally, we want to manage our infrastructure like we do code. We can check it into a repository, track updates, and run a single script to execute what we desire. Infrastructure as code provides a repeated, automated, testable, and fast way to create our cloud infrastructure.
Implementation of Pulumi for Infrastructure as Code
A project I released in the summer of 2021 is Secure Cloud Data Science. Step by step, this project walks through an AWS set up for data science, including all necessary Pulumi scripts. It's meant to be comprehensive. I won't repeat that project here but will rather redirect you to it. Some of the content has already been covered in this book but most has not. Instead of the project application, you could use the one from this book or your own.
Monitoring our Applications in AWS
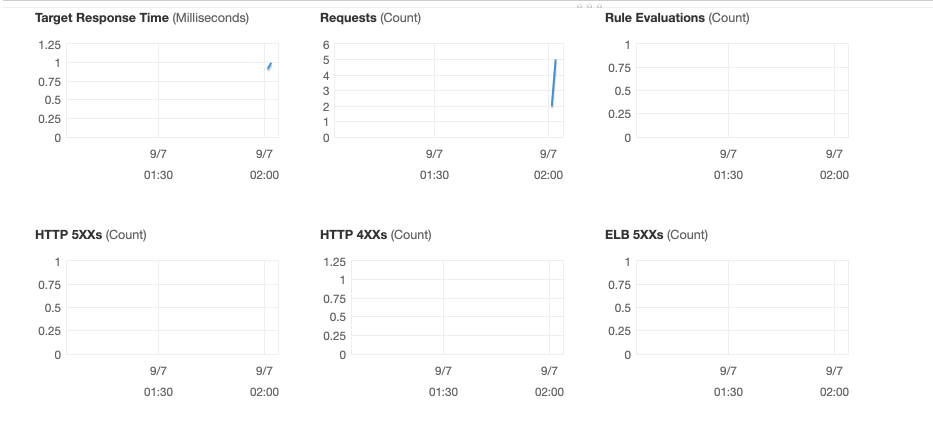
In our application, we have embedded Sentry to catch errors and alert us. This will be the main way we will catch production issues. However, we can also use AWS's built-in monitoring to help us understand the health of our application. We can build a slew of tracking dashboards in CloudWatch. However, for a quick view of the health of our service, we can go to our load balancer and check the metrics tabs.
Load Testing our API
If we expect our API to receive a large amount of requests, we want to make sure it can handle that load. Therefore, we might perform a "load testing" activity. That is, we pepper the the API with requests and see if it can still respond in a timely manner.
Canaries for Monitoring
With Sentry, we will be alerted to errors when a user interacts with our system. However, an issue may occur before a user does a GET or POST request. Therefore, with consistent monitoring, we can potentially catch issues earlier than we would otherwise. We could build a canary, which might make a small series of requests, say, every minute to verify the functionality of our endpoint. This could proactively find something like a database issue. As you might image, we could simply pivot our load testing script to accomplish this task. Likewise, we could use a dummy, identifiable client ID so that we could easily filter these requests from our logs.
Creating a Better-Looking Model UI using Streamlit
Alright, we have a model UI, but it doesn't look the best. We can recreate it using Streamlit, which is also the framework we used to create our configuration UI. Below is some code that will create a simple Streamlit app for our model. We could easily expand it and make it look even better!
Running our Model on AWS Batch
A separate paradigm for delivering our model is by running it on a schedule. We might have the model run so often and have the flagged customers emailed to a certain distribution. This can be a highly effective mechanism for deploying a model. To learn about setting up AWS Batch and running jobs, refer to Secure Cloud Data Science.
Re-Deploying Our Private Python Package
In chapter 6, we set up a private Python package we can install with pip on a static S3 website behind CloudFront behind Route53. Please review the following sections in the aforementioned chapter: Building a Library to Abstract Common Processes, Creating our own PyPi Server, and Using Pulumi to Set Up our PyPi Server. However, should we want, we could host our package as an ECS application! We could use the same Pulumi script we used to deploy our machine learning application. This repo displays how you might set this up.