Chapter Introduction: Data Science Definition and Ethics
“Data science” is a tricky term that has been defined many ways. I will give my definition, which might differ from what you’ve heard previously.
In my view, the term “data science” refers to a process. This process has a defined goal: generate predictions or optimizations that inform or trigger action. The data science process has specific steps, which I refer to as the data science pipeline.
- Data Ingestion
- Data Exploration
- Data Wrangling
- Modeling
- Model Deployment
- Model Tracking and Retraining
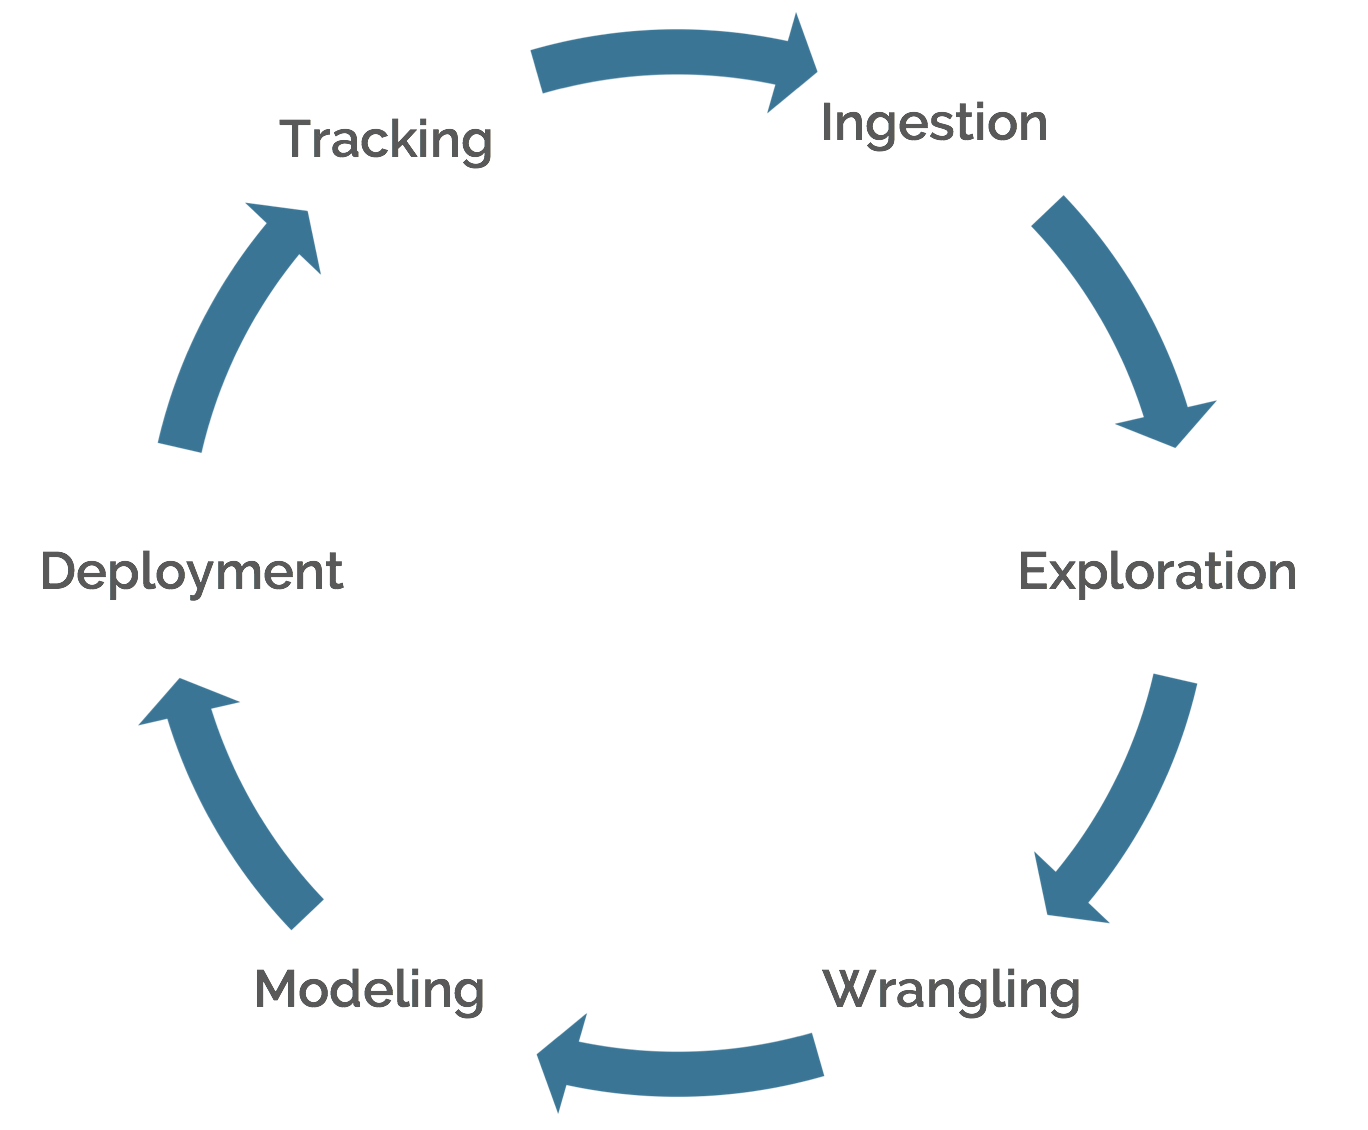
This paradigm is inspired by the excellent article The Age of the Data Product by District Data Labs. Full credit goes to them for the original idea. I have simply expanded their initial work.
Think of data science as being akin to building a car. We can't say we've built a car after only assembling the engine or if we have a missing steering wheel. Building a car is an entire process - it can't be viewed as a single step. Interpreting data science in the same way is beneficial. It's not building a model or cleaning data. It's all of these tasks stringed together.
Confusion about the domain of data science often arises because data scientists perform tasks that are not, well, data science. Since data scientists are typically proficient in many areas, they are often asked to work on tasks or projects that involve a limited number of components of the data science pipeline. Reporting done by a data scientist is not data science. It's reporting. Traditional statistics executed by a data scientist is not data science. It's still traditional statistics. Data scientists do data science when they work on projects that involve the full pipeline: ingestion, exploration, wrangling, modeling, deployment, and retraining.
Going Deeper: The Data Science Pipeline
The data science pipeline presented in the previous section is a useful tool for grasping the breadth of data science. However, the original graphic doesn't capture some important nuances. We can update it to the following.
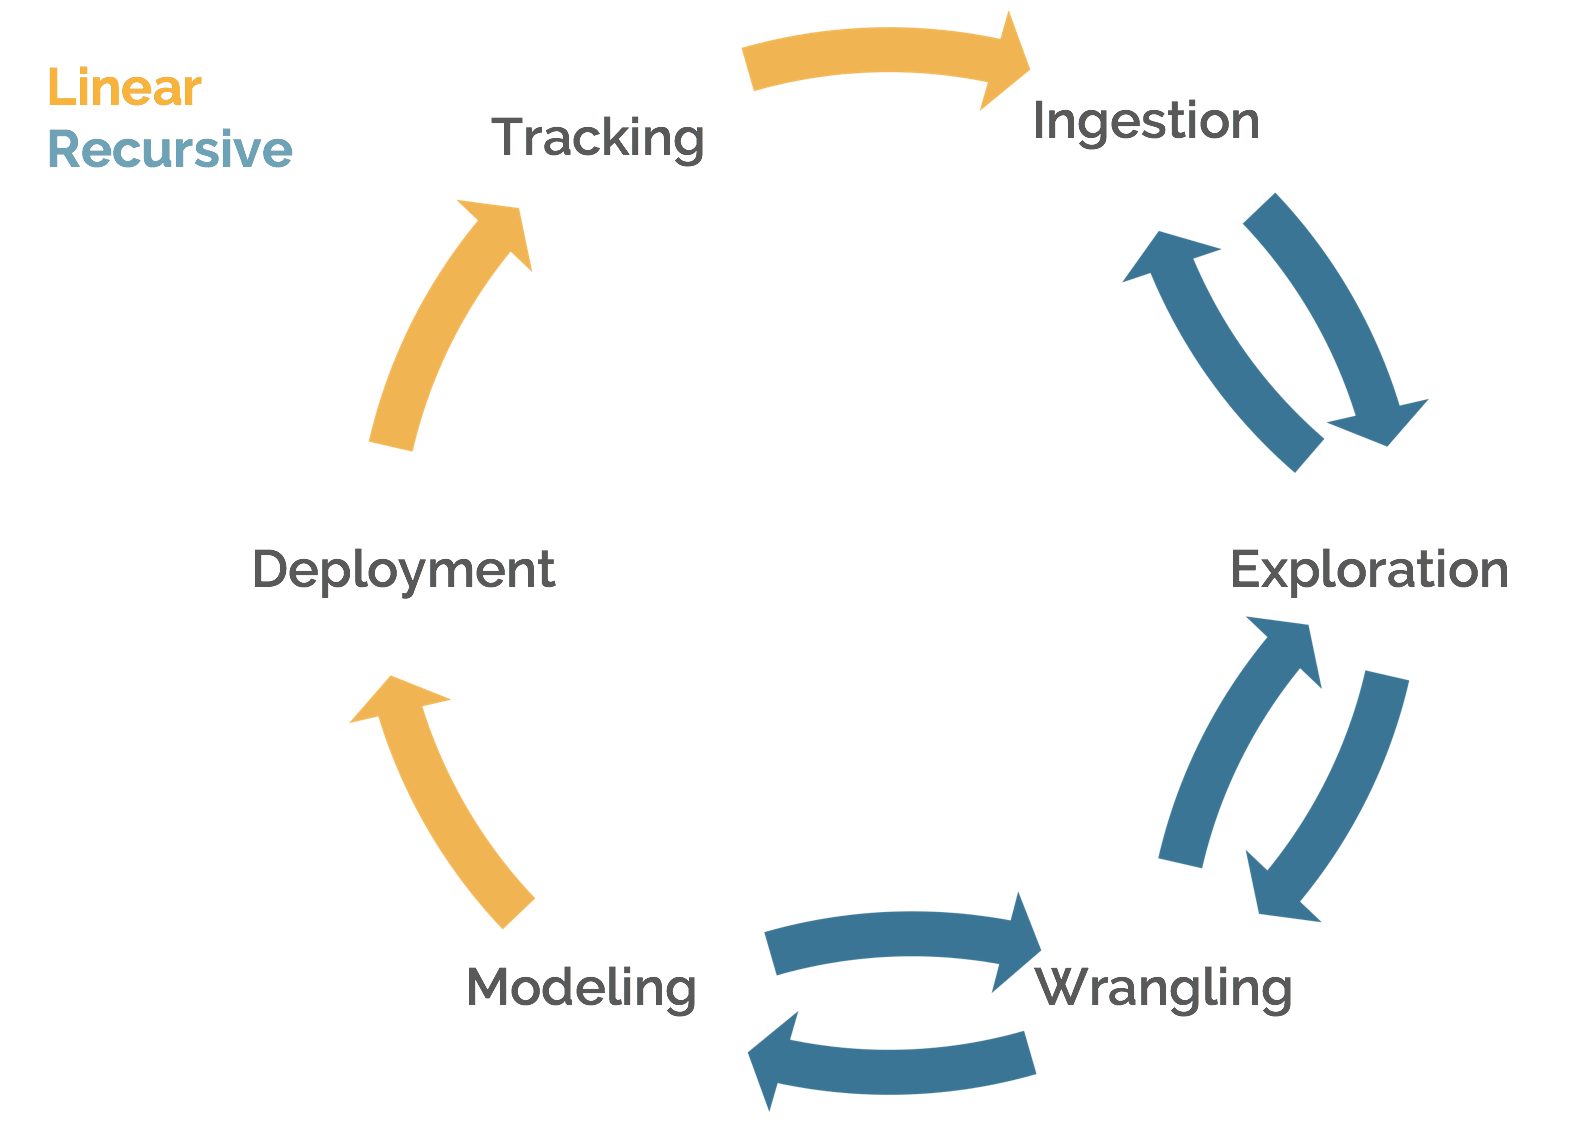
In the first half of the pipeline, we operate recursively. That is, we iterate upon our work and switch between steps as we experiment. For example, after we've explored our data, we might deem that we need to ingest more features. Likewise, after we build a model and inspect feature importance scores, we might wrangle (i.e. engineer) more features like those found to be most predictive. After we have our model, we proceed in a linear fashion. For instance, model deployment must lead into tracking; otherwise, we are blind to how our model is performing and how we might need to adapt our system.
We can position the pipeline in another paradigm as well. Since some steps are linear, they can also be automated.
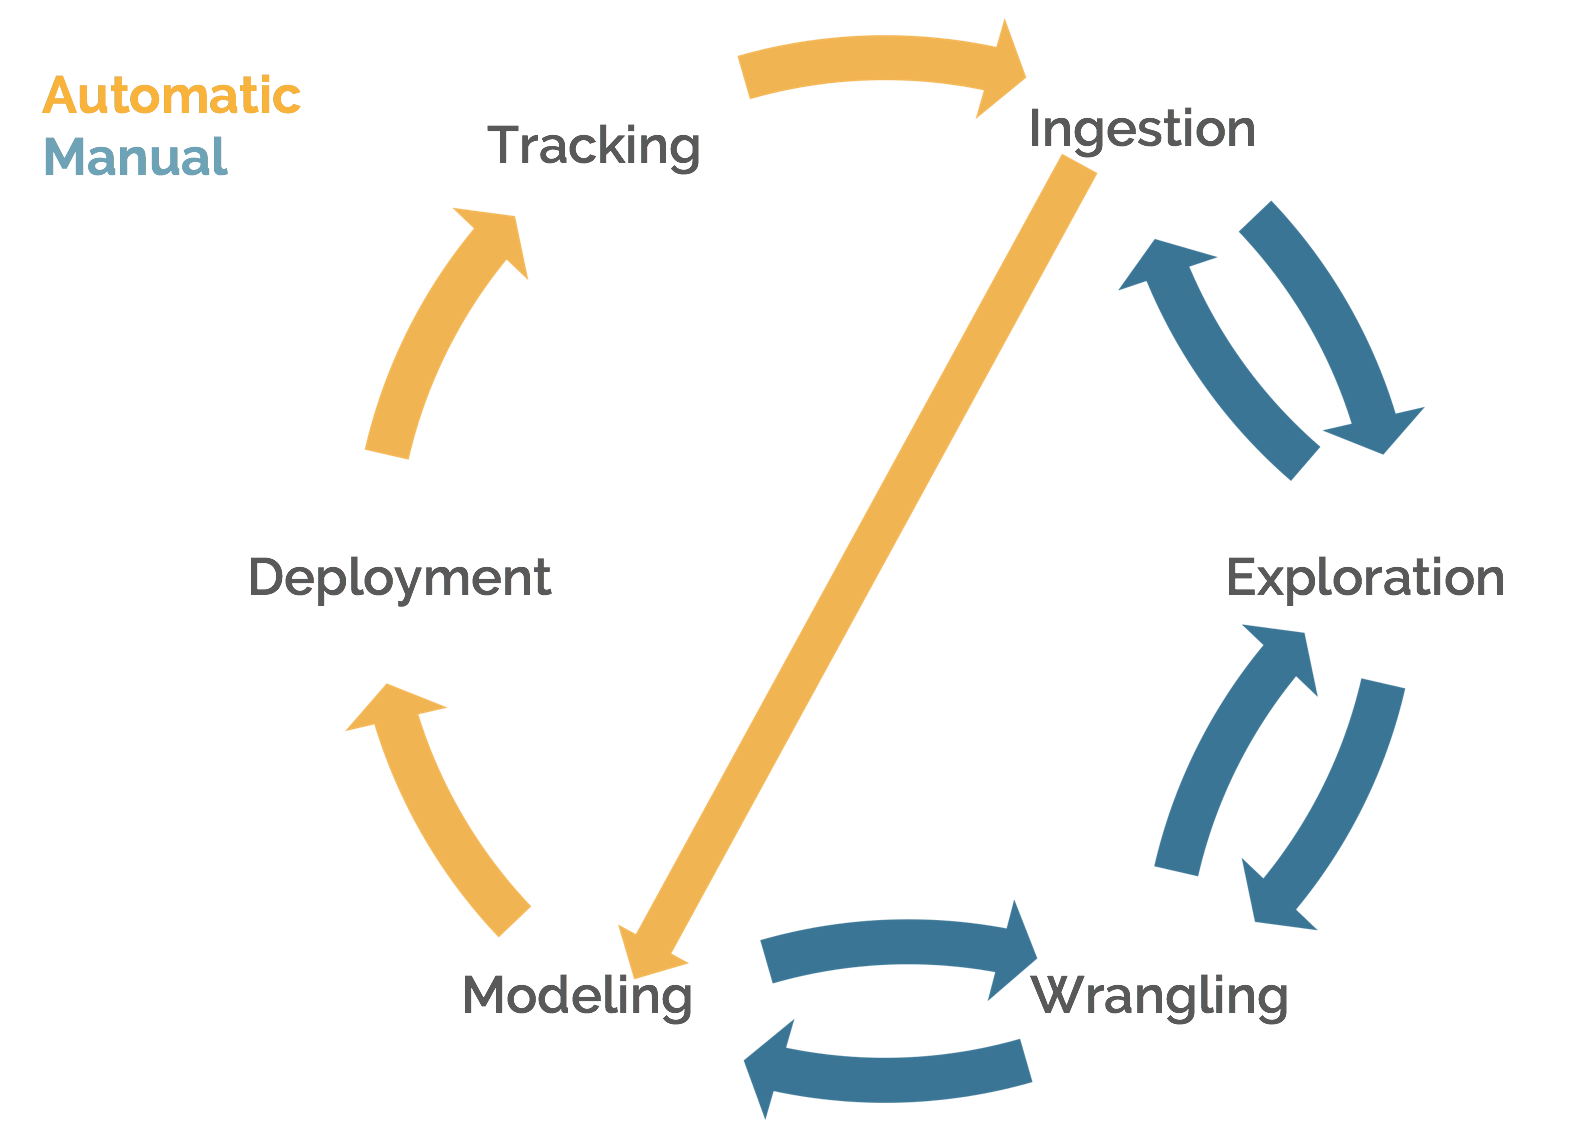
Once we have settled on a model, we can automatically retrain it using newly ingested data and have it deployed into production. Using our churn problem as an example, if we were in a true production setting, we would likely get reports of new churn events every day. We could run this new data through our model on a schedule (e.g. say, every week) and have an updated model pushed into production. If we need to deploy a model regularly, we do not want to have to always do it manually. As a general rule of thumb, if we have to perform some task repeatedly, we should invest in automating it if at all possible.
Data Science vs. Decision Science
I believe differentiation exists between data science and decision science. In contrast to data science, decision science is an analytical process aimed to aiding human understanding and interpretation. The first three steps of the "pipeline" are the same; we always need to ingest, explore, and wrangle our data. Divergence occurs at the modeling stage. Data science tends to be mostly concerned with predictive power and less focused on easy-to-understand results. In decision science, human interpretation is the goal.
A quick aside: I prefer the term "predictive power" over something like "accuracy". As we will see in a later chapter, accuracy is a misleading metric. If 95% of customers never churn, we can build a model that is 95% accurate by simply predicting "no churn" in all cases. Likewise, two models that are equally accurate may not be equally useful. For instance, if one model produces better probabilistic estimates within the defined class boundaries, it will be more useful even if it's not more "accurate" by classic terms.
OK, now back to decision science vs. data science.
A perfect example of the difference between the two topics is the use of decision trees in both domains. The decision tree is an algorithm that makes a series of conditional splits to provide a prediction. The graph below is the output from a scikit-learn decision tree. Since this is what we get natively from scikit-learn (the main machine learning library in Python), I will take the time to explain the output. What we can get out-of-the-box is admittedly a little confusing. To note, the data used is faked and a nod to my love of baseball.
In most boxes, we have five rows. First is the decision rule. Second is the gini impurity value. Third is the number of samples. Fourth is the class balance. Lastly, we have the predicted class. Our first decision is whether or not location_IL is <= 0.5. You might ask: how can the location be 0.5? scikit-learn models do not accept string values; everything must be coded as integers or floats. One way to represent categorical features (e.g. states) as integers is through dummy coding. That is, if the category is present, the value is 1. If it's not, the value is 0. Therefore, if location_IL is <= 0.5, the dummy coded value is 0 (i.e. not IL). If the value is not <= 0.5, then the dummy coded value is 1 (i.e. IL). Based on the decision split, when the location is IL, then none of the observations are Royals fans. If we are not in IL, we proceed to a split based on age. If the observation is less than 32.5 years old, we move to the left on the diagram. Here, we reach what's called a leaf node; there are no more splits. In this leaf node, all observations are Royals fans. If the observation is older than 32.5, we split to the right on our tree. We reach another split on age, a binary partition on age 42.5. If the observation is older than 42.5, they are a Royals fan. If they are under 42.5, but older than 32.5, they are not a Royals fan. In sum, we can conclude that no Royals fans are in IL. If they are not in IL, they are Royals fan if they are younger than 32.5 or older than 42.5.
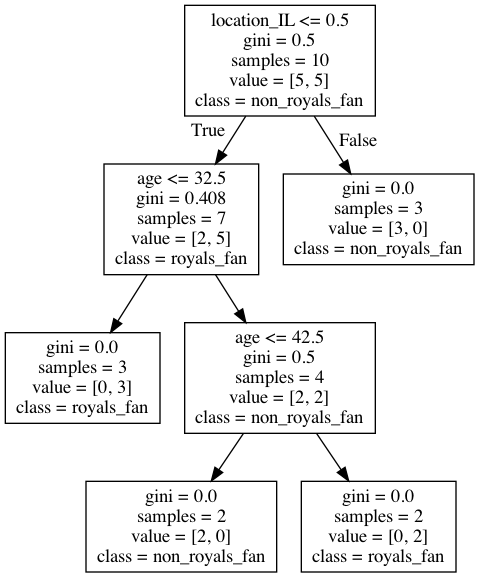
A single decision tree, as shown above, explains key differences between classes based on data, meaning it is a great tool for decision scientists. A human can look at the above graph and understand what is happening. By contrast, a data scientist would (hopefully) never use a single decision tree as a predictive model. Standalone decision trees are known to overfit; that is, they capture both signal and noise and do not generalize well to new observations. Rather, data scientists use ensembles of trees that sample both columns and rows to develop a predictive model (i.e. either random forest or extra trees, depending on the exact implementation). Essentially, data scientists trade the ability to show a graphic of a single tree for improved predictive capabilities. That said, robust ways exist for explaining the decisions of ensembles of trees. The tradeoff between interpretability and predictive power is (thankfully) shrinking.
For those interested, the above decision tree was generated with the following code:
A related difference is how models are used. In decision science, we will typically use a model to help explain the past. In data science, we will generally leverage a model to predict the future. You might think, "if we can explain the past, can't we predict the future?" In general, yes, but importance nuance exists. In decision science, we don't necessarily have to contend with the data we will have at prediction time. For example, let's say we are trying to build a model to predict if a customer will buy a gadget after responding to a piece of mail. A potential feature is the sales agent with whom the customer spoke. In the world of decision science, this might be a completely valid feature. We might want to control for the agent, or we might be specifically interested in their influence. However, in the realm of data science, this feature is problematic. We would ideally want to use our model to create an audience of prospects most likely to buy from a piece of mail. At the time we are making the prediction to construct the audience, we have no idea to what agent a customer might talk. This feature becomes unusable in a production setting and should not be included in the model. In data science, the data we use is bound to what we have available "in the wild" when the model is live. Our reality is tethered to whatever data we have at the time of making predictions. We cannot "leak" information from the future. Our goal is to predict effectively, which means we might have to sacrifice features that would be good only for explanation. This seems obvious, but the application can be tricky in practice. For instance, let's say we wanted to include each customers' lifetime value (LTV) as a feature. Good idea. However, we can't just slap on their LTV as it stands today. We have to recreate it historically so as not to leak information from the future. If we sent the mailer on 1/1/2020, then the LTV used in the model must be what it was as of that date. Again, our reality is our data at the time of prediction. Using the current LTV would not be great for a decision science project, but it could potentially be fatal for a data science project.
Additionally, in decision science, the model deployment step is often replaced with “visualization” or something like “report presentation”. Likewise, decision science may not include model deployment component. That said, deploying a dashboard or model UI would certainly fall under this category, so notable overlap can exist with data science on this element.
As the title indicates, this book will focus on data science rather than decision science. That's not to say decision science is not important - the opposite is true. Proper decision science can be extremely powerful. In fact, it can be so impactful that a data scientist is often wise to spend some of their time on decision science.
Production Data Science vs. Research Data Science
Another important differentiation is between production data science and research data science. In production data science, we care about predicting “out in the world.” We have data coming to our model, and we have systems and humans relying on the model working appropriately. Examples include models that trade stocks or bid on advertising space.
In research data science, we care about predicting on a holdout set of data, called the test set. For example, we have a set of images and want to pilot a new image recognition algorithm. The goal is to determine if this new model performs better on our test data than previous implementations. We want to validate a new methodology.
In this book, we will focus on production data science.
Big Data
Thus far, I have not used the term “big data.” Outside this section, I will not write that term again. In my opinion, the phrase is overused and misused. In my view, “big data” can refer to both a concept and an engineering problem.
As a concept, “big data” refers to the fact that many of our actions leave traces. Virtually everything we do on an Internet browser is recorded; wearable technologies record a barrage of health-related diagnostics...you get the picture. Technological advancement has enabled us to collect large amounts of data.
As an engineering problem, “big data” means we have to develop bespoke applications to perform even routine operations. Popular innovations in this space include Hadoop and Spark. We hear that “big data” is ubiquitous, but I’m not sure that’s the case. Yes, Netflix, Facebook, Google, and the like deal with really big data. I would say that many companies can survive by spinning up large servers on AWS. (As you’ll see later in the book, this task isn’t too difficult). Using AWS, you can spin up a server with 96 CPUS and 384 gigs of memory. That’s a massive computing resource that can handle millions of data points. I would venture a guess that amount of horsepower could handle many company's datasets. Companies are also saved the need to spend computational resources because the value of data generally decays over time. A company could have millions of customer records, but data on how those customers were obtained five years ago might not be valid for current marketing models. The world evolves, and building models based on dated data can be harmful. Mother Change shrinks our datasets for us.
There’s a lot of hype about big data, but I still see a lot of crappy, poorly-targeted advertisements. We have a lot of healthcare data, but the healthcare system is still fraught with problems. We have a boatload of data about the economy, but financial systems still blow up. Companies sit on vast amounts of data, but some still fail. Many people state some tautology like “companies are data rich but information poor” or “firms don’t know how to leverage their data”. These statements have truth to them. However, they fail to acknowledge that some problems are highly complex and flat-out challenging to solve. While we’re in a world of “big data”, we cannot eliminate noise in the data. Data is almost never all signal. We might have two customers who look identical, one of them purchased our product and one didn’t. That outcome could be due to randomness or because there is relevant data we could never capture (e.g. one ate breakfast, and another didn’t). While having large amounts of data makes solving problems possible, don’t believe the hype that big data is a panacea in all domains. Big data can help solve difficult problems in amazing ways, but it will still run into struggles with complex problems (don’t worry, we’ll talk about the distinction in the next chapter).
What Makes a Great Data Scientist?
While we’re on the topic of defining data science, now is an opportune time to address the traits that make a great data scientist. I again cannot avoid a trite statement. If you ask 10 data scientists what makes someone great in their field, you’ll get 10 different answers. In my view, the most important qualities of data scientists are tricky to nail down because there are so many different types of data scientists. Some develop new algorithms. Others create dynamic visualizations. Some author amazing open-source software. Others optimize engineering processes. I will not attempt to unify traits for all types of data scientists. Rather, I will supply an opinion on the characteristics of effective applied full stack data scientists. What do I mean by this? I am referring to individuals who can perform all phases of the data science pipeline on their own: Data Ingestion, Data Exploration, Data Wrangling, Modeling, Model Deployment, and Model Tracking and Retraining.
- Curious. Full stack data science is a broad topic. Wanting to continually learn and investigate new opportunities is a must.
- Quick Learner. Since the topic is varied, being able to learn quickly is also a highly useful skill. Clearly, some topics will have steeper learning curves than others, but being able to hack away using new methodologies is valuable.
- Resilient Full stack data science is challenging, and failure will happen. Moving forward in the face of challenge is required. (I could be a corny motivational speaker, don't you think?)
- Adaptable. Machine learning systems sometimes break, fail, or display unexpected behavior. Finding root causes and pivoting system architecture is sometimes a necessity.
- Willing. Data scientists are often called upon to solve complex and pressing business problems. Some problems are plain difficult to solve. Being willing to dig in, always lend a helping hand, and get the job done is a valuable mentality. Software development can be encompassed by process, which has its place. But sometimes the process needs to be broken, and you have to be gritty and do what needs to be done on a timeline the business needs, not based on what your Scrum Master wants.
- Technically Versatile. Without question, full stack data science requires some level of proficiency in all areas of the data science pipeline.
Data Science Ethics
From my perspective, ethics is more prominent a topic in data science than many, not all, fields. From my perspective, again, this is a good thing. The ethics of data science are multi-faceted and complex in many respects. In this book, we won't delve into philosophic discussions about artificial intelligence, autonomous cars, or machines replacing humans. Instead, we'll focus on the practical application of ethical principles in routine data science work. This is a book about application, after all.
One of the canonical ethical issues in data science is injecting unintended bias against certain classes of people into algorithms. This is bad. This is harmful. These issues should be taken seriously. As an optimistic person, I assume that many biased algorithms were not constructed that way intentionally. Rather, the training data might have been biased, feature selection might not have been taken seriously enough, or predictions on the holdout data might not have been examined with sufficient care. Bias can creep in many different ways. My best advice is to be aware and alert during each phase of the data science pipeline. Likewise, if there is a feature in your dataset that is ripe for introducing bias, my advice would be to discard it unless there is a very, very valid reason for its inclusion. If you do not discard it, pay extra close attention to how the model handles the feature and strongly interrogate the model for signs of bias.
Another important ethical topic in data science is intellectual honesty. Intellectual honesty is seeking the truth regardless of personal beliefs, rejecting assertions that don't have sufficient proof, and always applying rigor to the work. As data scientists, we are consistently asking interesting questions about our organization's data. We might discover that long-held beliefs within the organization are not true or only valid under nuanced circumstances. We must not succumb to political pressures to find predestined results or patterns. Seeking the truth, regardless of others' opinions, is not always easy, but it is crucial in data science. An organization that properly leverages data science and decision science gives the data scientist influence over how decisions are made, both by systems and by humans. This is a powerful position! Taking this responsibility seriously, our focus should be on what the data tells us instead of what others tell us.
Related, we must have the moral fiber to give the answer of "I don't know" or "the results are inconclusive". We must be humble in the face of complexity. We won't always be able to find an answer. That is totally and 100% valid. Finding that outcomes are inconclusive is a finding! Potentially, it's an important finding, though not one stakeholders always want to hear. Likewise, we need to caveat when results are tentative, highlight what assumptions were made, and call out any underlying issues with the data. The world is messy. Data is messy. Few tasks in data science are actually straightforward. Recognizing and communicating this fact is highly important.
Explaining Some Important Recurring Concepts
Throughout the book, I will reference a few important data science concepts. Explaining some of these items up front will be instructive.
- Modeling Pipeline. When we think of constructing a model, we sometimes only think about the machine learning algorithm. However, we should instead think about the modeling pipeline, that is, the set of data cleaning and engineering steps and the ML algorithm. Our data cleaning and engineering steps directly impact our model. We should think of them as a package, conjoint with our model. In fact, we should encode them into the same Python object, in this case a scikit-learn Pipeline class. The parameters of our machine learning models can and do interact with how we clean and engineer our data. In addition to tuning the knobs of our ML model, we should also tune the parameters of our data cleaning and engineering to find what produces the best model. What's more, we need to optimize our data preprocessing and our model together due to their interplay. We can perform this optimization jointly in our modeling pipeline.
- Model Calibration. When we build machine learning models to predict class membership (e.g. churn or no churn), we oftentimes want to actually predict the underlying probability. For instance, knowing how likely a customer is to churn is most instructive. When we predict a probability, we likely want it to align with a real-world, actual probability. In other words, we want the probability to correspond to a direct confidence level (a 5% probability really means a 5% chance of occurring). In many cases, the raw probabilities from machine learning models have idiosyncrasies. The cardinality of the probability estimates is still valid in those cases, but they cannot be directly interpreted as confidence levels. Do not trust the raw probabilities from most machine learning models! We have to calibrate the predictions to be true probabilistic estimates.
- Training and Testing Sets. We split our modeling data into two partitions: training and testing. We optimize our model's settings on the training data, and we investigate its predictive performance on the testing set.
- Feature Leakage. This means we are allowing our model to cheat. As the term indicates, we are "leaking" information into our model that makes our predictions too good to be true. Such a situation can occur in multiple ways. Here are some illustrative examples:
- The column activity_score has null values. We use our entire dataset to calculate the column's mean and use that value to fill in the nulls. We then split our data into a training set, meant to train the model, and a testing set, intended to help us see how the model will generalize to new, never-before-seen observations. However, we have used data from our test set to calculate the mean of activity_score! We have employed information in our training set that it should not have any knowledge of.
- When predicting customer churn, we extract the month from a column titled churn_date and use it as a feature. This is an unrealistic column to include: only people who have churned will have this feature! This is not a feature we can use to predict what will happen as it simply tells us what has happened. Whenever you see a feature that perfectly or almost perfectly predicts the outcomes, your mind should hop to the possibility of feature leakage.
- Feature leakage can, however, sneak into models in more pernicious ways. Let's stick with our churn example and say we want to use a feature called total_fees_paid as a predictor of churn. This feature includes a charge when someone cancels their membership. Therefore, churners will have systemically inflated total_fees_paid values. To avoid any leakage this might cause, we should remove the cancellation fee from total_fees_paid.
-
Cross Validation. This is a core concept in machine learning. Simply, cross validation
splits our training data into training and testing sets in a rotating fashion. To begin this process,
we select the number of folds (referred to as k) we want in our cross validation scheme. To keep it simple,
we'll select a small number of 3 folds in this example. Selecting k=3, we randomly split our data into
three folds. We then fit three separate models, with each fold being used as the testing set one time. (We
still employ our testing set as a final evaluation).
- Fit 1: folds 1 and 2 are used for training, and fold 3 is used for testing.
- Fit 2: folds 2 and 3 are used for training, and fold 1 is used for testing.
- Fit 3: folds 1 and 3 are used for training, and fold 2 is used for testing.
- Deployment Pipeline. We previously discussed the modeling pipeline. We also need to be aware of the deployment pipeline. When we want to push our model into production, it will go through a series of deployment steps, which may includes running tests, compiling the code, and putting the relevant code on production servers.